---
title: anova
date: '2026-07-14'
categories:
- paper
- todo
---

```{r data generation, echo = FALSE, results = "hide"}
library(exams)
## DATA GENERATION
n <- 9 + sample(1:6, 4)
dat <- data.frame(Evaluation = rnorm(sum(n),
    mean = rep(sample(seq(from = sample(25:55, 1), by = 1, length.out = sample(15:20, 1)), 4)/10, n),
    sd = rep(sample(70:80, 4)/100, n)),
  Occupation = factor(rep(1:4, n),
    labels = c("Student", "Employee", "Self-Employed", "Retired")))
dat$Evaluation[dat$Evaluation > 10] <- 10
dat$Evaluation[dat$Evaluation <  0] <-  0

## QUESTION/ANSWER GENERATION
questions <- character(5)
solutions <- logical(5)
explanations <- character(5)

fm0 <- lm(Evaluation ~ 1, data = dat)
fm1 <- lm(Evaluation ~ Occupation, data = dat)
myanova <- anova(fm0, fm1)
myanova_print <- matrix(nrow = 2, ncol = 6)
dimnames(myanova_print) <- dimnames(myanova)
myanova_print[, 1] <- round(myanova[, 1])
myanova_print[, 3] <- fmt(myanova[, 3], 0)
rss <- round(myanova[,2], digits = max(0, min(3, 5-max(nchar(round(myanova[, 2], digits = 0))))))
myanova_print[, 2] <- format(rss, nsmall = max(0, min(3, 5-max(nchar(round(myanova[, 2], digits = 0))))))
myanova_print[2, 4] <- format(-diff(rss), nsmall = max(0, min(3, 5-max(nchar(round(myanova[, 2], digits = 0))))))
myanova_print[1, 3:6] <- ""
myanova_print[2, 5] <- round(myanova[2, 5], digits = 3)
myanova_print[2, 6] <- format.pval(myanova[2, 6])
r2 <- 1 - as.numeric(rss[2])/as.numeric(rss[1])

f2 <- sample(10:250, 1)/10
if(runif(1) > 0.5) {
  questions[1] <- paste0("The test statistic is smaller than $", f2, "$.", sep = "")
  solutions[1] <- myanova[2,5] < f2
  explanations[1] <- paste0("The test statistic is $F = ", fmt(myanova[2,5], 3),
    "$ and hence ", ifelse(solutions[1], "", "_not_"), " smaller than $", f2, "$.", sep = "")
} else {
  questions[1] <- paste0("The test statistic is larger than $", f2, "$.", sep = "")
  solutions[1] <- myanova[2,5] > f2
  explanations[1] <- paste0("The test statistic is $F = ", fmt(myanova[2,5], 3),
  "$ and hence ", ifelse(solutions[1], "", "_not_"), " larger than $", f2, "$.", sep = "")
}

questions[2] <- "A one-sided alternative was tested for the mean values."
solutions[2] <- FALSE
explanations[2] <- paste("An ANOVA always tests the null hypothesis,",
  "that all mean values are equal against the alternative hypothesis that they are different.")

r2a <- sample(10:60, 1)/100
questions[3] <- paste0("The fraction of explained variance is larger than $", 100 * r2a, "$%.", sep = "")
solutions[3] <- r2 > r2a
explanations[3] <- paste0("The fraction of explained variance is $", fmt(r2, 3),
  "$ and hence ", ifelse(solutions[3], "", "_not_"), " larger than ", r2a, ".", sep = "")

questions[4] <- paste("It can be shown that the evaluation of the respondents depends on their occupation.",
                      "(Significance level $5$%)")
solutions[4] <- myanova[2,6] < 0.05
explanations[4] <- paste0("The $p$ value is $", format.pval(myanova[2,6], digits = 3),
  "$ and hence", ifelse(solutions[4], "", "_not_"),
  " significant. It can ", ifelse(solutions[4], "", "_not_"),
  " be shown that the evaluations differ with respect to the occupation of the respondents.")

r2b <- sample(10:60, 1)/100
questions[5] <- paste0("The fraction of explained variance is smaller than $", 100 * r2b, "$%.", sep = "")
solutions[5] <- r2 < r2b
explanations[5] <- paste0("The fraction of explained variance is $", fmt(r2, 3),
  "$ and hence ", ifelse(solutions[5], "", "_not_"), " smaller than ", r2b, ".", sep = "")

## permute order of solutions/questions
o <- sample(1:5)
questions <- questions[o]
solutions <- solutions[o]
explanations <- explanations[o]
```

Question
========
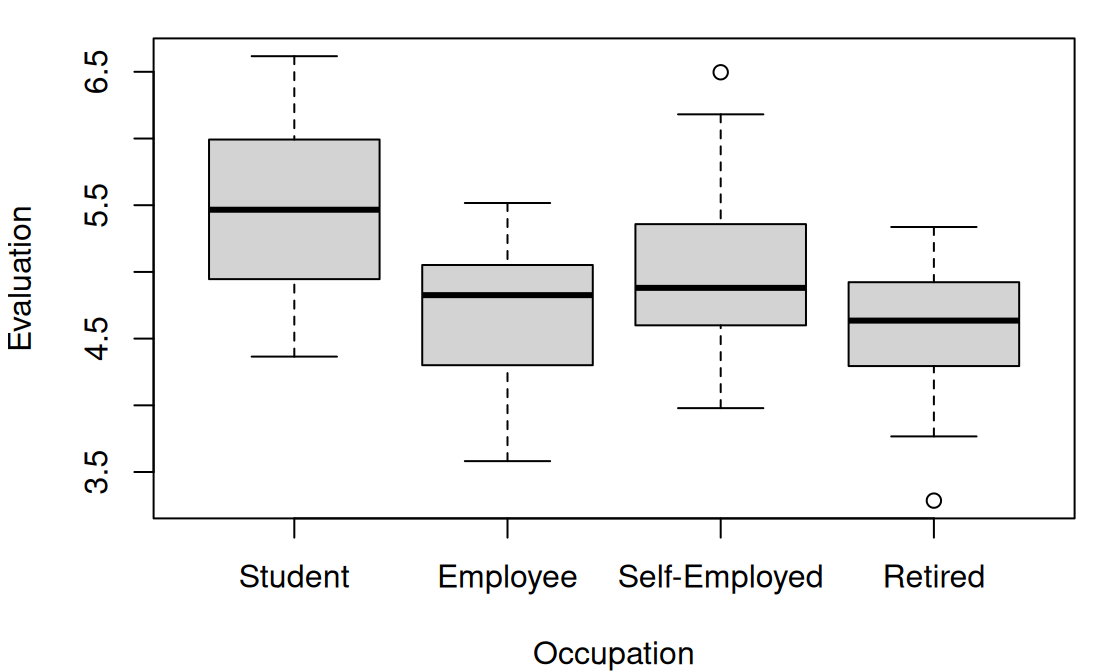
A survey with `r sum(n)` persons was conducted to analyze the
design of an advertising campaign. Each respondent was asked to
evaluate the overall impression of the advertisement on an
eleven-point scale from 0 (bad) to 10 (good). The evaluations are
summarized separately with respect to type of occupation of the
respondents in the following figure.
\
```{r boxplots, echo = FALSE, results = "hide", fig.height = 3.5, fig.width = 5.8, fig.path = "", fig.cap = ""}
par(mar = c(4, 4, 1, 1))
plot(Evaluation ~ Occupation, data = dat)
```

To analyze the influence of occupation on the evaluation of the
advertisement an analysis of variance was performed:

```{r anova output, echo = FALSE, comment = NA}
options(show.signif.stars = FALSE)
print(myanova_print, quote = FALSE, right = TRUE)
```

Which of the following statements are correct?

```{r questionlist, echo = FALSE, results = "asis"}
answerlist(questions, markup = "markdown")
```

Solution
========
In order to be able to answer the questions the fraction of
explained variance has to be determined. The residual sum of squares
when using only a single overall mean value ($\mathit{RSS}_0$) as
well as the residual sum of squares when allowing different mean
values given occupation ($\mathit{RSS}_1$) are required. Both are
given in the RSS column of the ANOVA table.  The
fraction of explained variance is given by
$1 - \mathit{RSS}_1/\mathit{RSS}_0 = 1 - `r rss[2]`/`r rss[1]` =
`r round(r2, digits = 3)`$.

The statements above can now be evaluated as right or wrong.


Aufgabenname: `anova`


```{r solutionlist, echo = FALSE, results = "asis"}
answerlist(ifelse(solutions, "True", "False"), explanations, markup = "markdown")
```

Meta-information
================
extype: mchoice
expoints: 1
exsolution: `r mchoice2string(solutions)`
exname: anova