Aufgabe
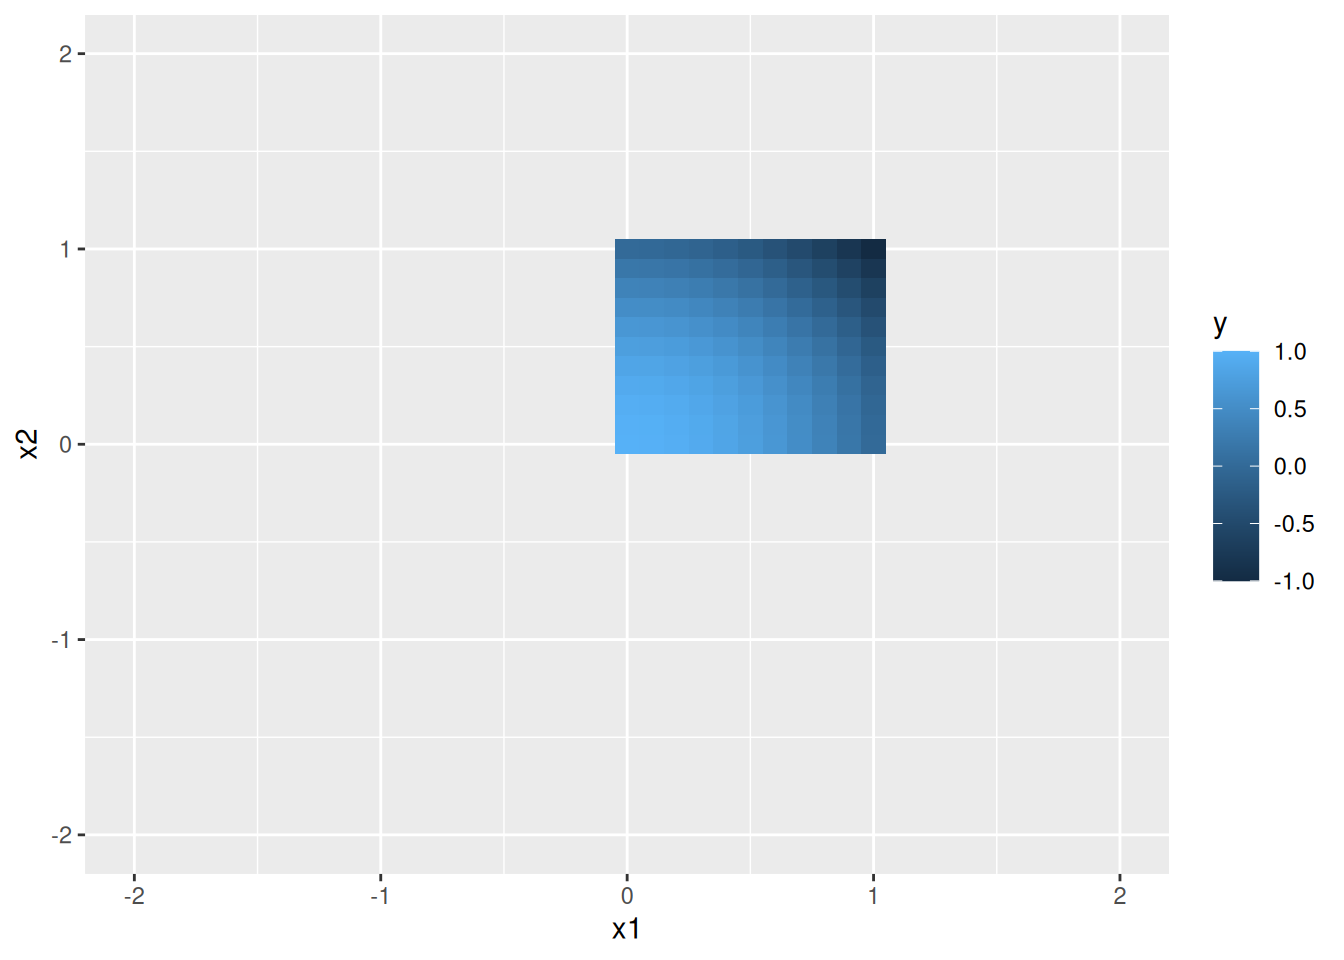
Visualisieren Sie die Gini-Funktion!
Lösung
── Attaching core tidyverse packages ──────────────────────── tidyverse 2.0.0 ──
✔ dplyr     1.1.3     ✔ readr     2.1.4
✔ forcats   1.0.0     ✔ stringr   1.5.1
✔ ggplot2   3.4.4     ✔ tibble    3.2.1
✔ lubridate 1.9.3     ✔ tidyr     1.3.0
✔ purrr     1.0.2
── Conflicts ────────────────────────────────────────── tidyverse_conflicts() ──
✖ dplyr::filter() masks stats::filter()
✖ dplyr::lag()    masks stats::lag()
ℹ Use the conflicted package (<http://conflicted.r-lib.org/>) to force all conflicts to become errors
granularity <- .1
x1 = seq(from = 0, to = 1, by = granularity)
x2 = seq(from = 1, to = 0, by = -granularity)
#x2 <- 1 - x1

d <- expand_grid(x1, x2)
Gini-Loss:
gini_loss <- function(x1, x2) {1 - (x1^2 + x2^2)}
Funktion berechnen:
d2 <-
  d %>%
  rowwise() %>%
  mutate(y = gini_loss(x1, x2))
# d2 <-
#   outer(x1, x3, FUN = gini_loss) %>%
#   as_tibble() %>%
#   pivot_longer(cols = everything())
# d <-
#   d %>%
#   mutate(
#     x3 = 1 - x1,
#     y = 1 - (x1^2 + x3^2))
d2 %>%
  ggplot(aes(x1, x2, fill = y)) +
  geom_tile() +
  scale_x_continuous(limits = c(-2, 2)) +
  scale_y_continuous(limits = c(-2, 2))
So sieht der Funktionsgraph in Geogebra aus.
Categories:
- 2023
- vis
- statlearning
- tree
- string