Importieren Sie das Grundatzprogramm der Partei AfD (in der aktuellsten Version). Tokenisieren Sie nach Seiten. Dann verschachteln Sie die Spalte, in denen der Text der Seite steht, zu einer Listenspalte. Schließlich zählen Sie die Anzahl der Wörter pro Seite und berichten gängige deskriptive Statistiken dazu.
Solution
library(tidyverse)
── Attaching core tidyverse packages ──────────────────────── tidyverse 2.0.0 ──
✔ dplyr     1.1.3     ✔ readr     2.1.4
✔ forcats   1.0.0     ✔ stringr   1.5.0
✔ ggplot2   3.4.4     ✔ tibble    3.2.1
✔ lubridate 1.9.3     ✔ tidyr     1.3.0
✔ purrr     1.0.2
── Conflicts ────────────────────────────────────────── tidyverse_conflicts() ──
✖ dplyr::filter() masks stats::filter()
✖ dplyr::lag()    masks stats::lag()
ℹ Use the conflicted package (<http://conflicted.r-lib.org/>) to force all conflicts to become errors
Text aus PDF-Dateien kann man mit dem Paket pdftools einlesen:
# A tibble: 1 × 2
  data              word_count_per_page
  <list>            <list>
1 <tibble [96 × 1]> <int [96]>
Wie sieht eine Zelle aus data aus?
d3$data[[1]]
# A tibble: 96 × 1
   text
   <chr>
 1 "PROGRAMM FÜR\nDEUTSCHLAND.\nDas Grundsatzprogramm der Alternative für Deuts…
 2 "2   Programm für Deutschland | Inhalt\n\n\n\n\n    Präambel\t\t\t\t\t\t    …
 3 "3   Programm für Deutschland | Inhalt\n\n\n\n\n    7 | Kultur, Sprache und …
 4 "4   Programm für Deutschland | Inhalt\n\n\n\n\n    11 | Finanzen und Steuer…
 5 "Präambel.\n"
 6 "6   Programm für Deutschland | Präambel\n\n\n\n\n    MUT ZU DEUTSCHLAND.   …
 7 "KAPITEL 1\n\n\n\n\nDemokratie und\nGrundwerte\n"
 8 "8   Programm für Deutschland | Demokratie und Grundwerte\n\n\n\n\n    DEMOK…
 9 "9   Programm für Deutschland | Demokratie und Grundwerte\n\n\n\n\n    1.1 V…
10 "10   Programm für Deutschland | Demokratie und Grundwerte\n\n\n\n\n     ble…
# ℹ 86 more rows
Wie sieht eine Zelle aus word_count_per_page aus?
d3$data[[1]]
# A tibble: 96 × 1
   text
   <chr>
 1 "PROGRAMM FÜR\nDEUTSCHLAND.\nDas Grundsatzprogramm der Alternative für Deuts…
 2 "2   Programm für Deutschland | Inhalt\n\n\n\n\n    Präambel\t\t\t\t\t\t    …
 3 "3   Programm für Deutschland | Inhalt\n\n\n\n\n    7 | Kultur, Sprache und …
 4 "4   Programm für Deutschland | Inhalt\n\n\n\n\n    11 | Finanzen und Steuer…
 5 "Präambel.\n"
 6 "6   Programm für Deutschland | Präambel\n\n\n\n\n    MUT ZU DEUTSCHLAND.   …
 7 "KAPITEL 1\n\n\n\n\nDemokratie und\nGrundwerte\n"
 8 "8   Programm für Deutschland | Demokratie und Grundwerte\n\n\n\n\n    DEMOK…
 9 "9   Programm für Deutschland | Demokratie und Grundwerte\n\n\n\n\n    1.1 V…
10 "10   Programm für Deutschland | Demokratie und Grundwerte\n\n\n\n\n     ble…
# ℹ 86 more rows
Ah! Darin steckt nur eine einzelne Zahl!
d3$data[[1]] %>%str()
tibble [96 × 1] (S3: tbl_df/tbl/data.frame)
 $ text: chr [1:96] "PROGRAMM FÜR\nDEUTSCHLAND.\nDas Grundsatzprogramm der Alternative für Deutschland.\n" "2   Programm für Deutschland | Inhalt\n\n\n\n\n    Präambel\t\t\t\t\t\t                                        "| __truncated__ "3   Programm für Deutschland | Inhalt\n\n\n\n\n    7 | Kultur, Sprache und Identität\t\t\t\t                   "| __truncated__ "4   Programm für Deutschland | Inhalt\n\n\n\n\n    11 | Finanzen und Steuern\t\t\t\t\t                         "| __truncated__ ...
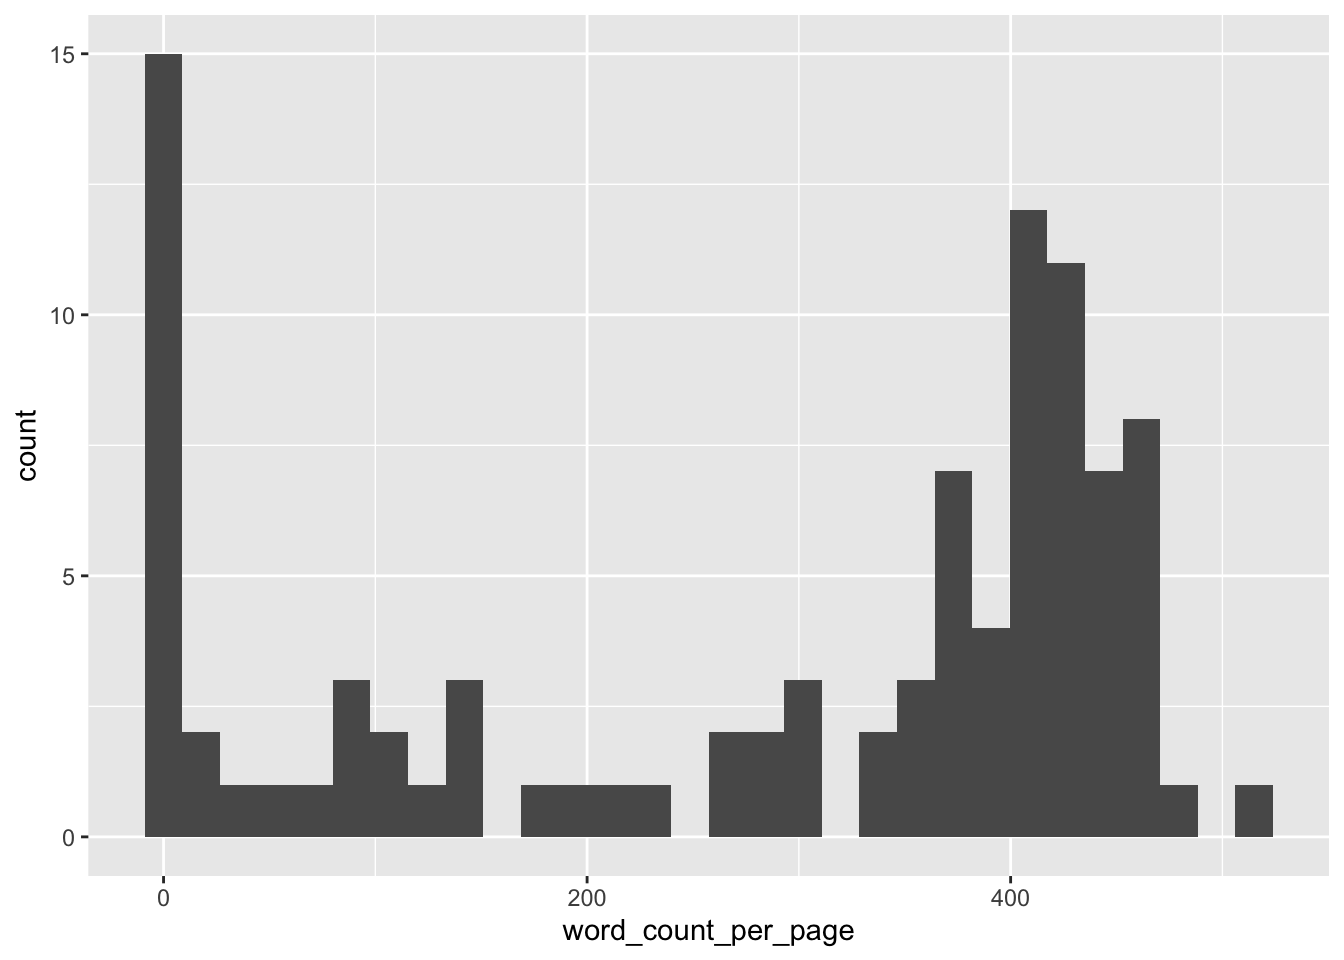
---extype: stringexsolution: NAexname: purrr-map04expoints: 1categories:- R- map- tidyversedate: '2022-10-24'slug: purrr-map04title: purrr-map04---# ExerciseImportieren Sie das Grundatzprogramm der Partei AfD (in der aktuellsten Version). Tokenisieren Sie nach Seiten. Dann verschachteln Sie die Spalte, in denen der Text der Seite steht, zu einer Listenspalte.Schließlich zählen Sie die Anzahl der Wörter pro Seite und berichten gängige deskriptive Statistiken dazu.</br></br></br></br></br></br></br></br></br></br># Solution```{r}library(tidyverse)```Text aus PDF-Dateien kann man mit dem Paket [`pdftools`](https://docs.ropensci.org/pdftools/) einlesen:```{r}library(pdftools)d_path <-"~/Literatur/_Div/Politik/afd-grundsatzprogramm-2022.pdf"d <-tibble(text =pdf_text(d_path))```Zu Seiten tokenisieren brauchen wir nicht; das Datenmaterial ist bereits nach Seiten organisiert.Jetzt "verschachteln" (to nest) wir die Spalte mit dem Text:```{r}d2 <- d %>%nest(data = text)head(d2)```Dann zählen wir die Wörter pro Seite:```{r}d3 <- d2 %>%mutate(word_count_per_page =map(data, ~str_count(.x$text, "\\w+")))head(d3)```Wie sieht eine Zelle aus `data` aus?```{r}d3$data[[1]]```Wie sieht eine Zelle aus `word_count_per_page` aus?```{r}d3$data[[1]]```Ah! Darin steckt nur eine einzelne Zahl!```{r}d3$data[[1]] %>%str()```Das heißt, wir können vereinfachen, entschacheln:```{r}d4 <- d3 %>%unnest(word_count_per_page)head(d4)```Visualisierung:```{r}d4 %>%ggplot(aes(x = word_count_per_page)) +geom_histogram()``````{r}library(easystats)describe_distribution(d4$word_count_per_page)```---Categories: - R- map- tidyverse